

Anti-TNF Receptor 1


Data
 Western blot showing TNF-a and TNF-R1 protein expression levels in the cerebral artery after 24 and 48 h organ culture (OC) as compared with fresh vessel (control). Beta-actin was used as a loading control. Data are expressed as mean ± S.E.M., n = 4. *P < 0.05, **P < 0.01 and *** P < 0.001.
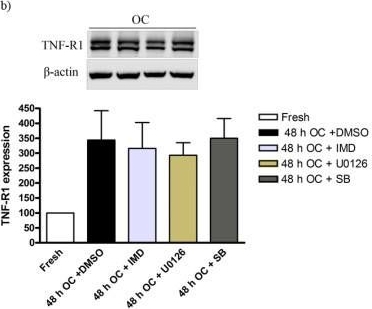 Western blot of TNF-a, TNF-R1 and TNF-R2 protein levels from rat cerebral arteries; after 0 h (fresh), 48 h organ culture (OC) + DMSO, 48 h OC + (IMD-0354, SB386023-b or U0126) together with Beta-actin as loading control are shown. UO126 treatment significantly decreased the increase protein level of TNF-a after 48 h culture (a). Data are presented as the TNF-a, TNF-R1 and TNF-R2/Beta-actin mean optical density ratio relative to fresh (a-b) or vehicle (48 h OC + DMSO) (c). Data are presented as mean S.E.M. *P < 0.05.
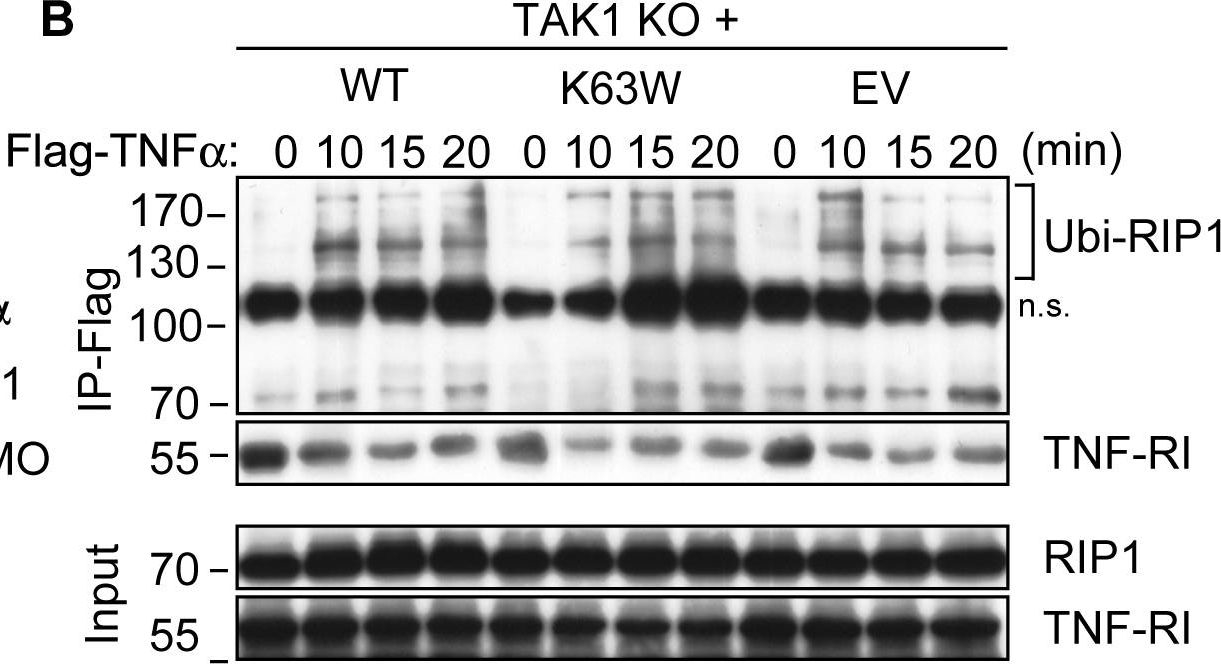 TAK1 blocks TNFα-induced necrosis independently of its kinase activity.(A) TAK1 KO MEFs transfected with a WT or a kinase-dead mutant (K63W) construct of TAK1 along with untransfected and empty-vector (EV) transfected cells were stimulated with TNFα and analyzed by WB for IκBα degradation as well as TAK1 and NEMO expression. (B) Cells were stimulated with Flag-TNFα and Ubi-RIP1 interaction with complex-I was analyzed by immunoprecipitating Flag-TNFα-bound TNF-RI and associated factors by a-Flag M2 affinity beads as in Fig. 3C. (C) Indicated cells were stimulated with TNFα and necrosome formation was investigated by immunoprecipitating FADD as in Fig. 3A and 3B. (D) Cells were stimulated with TNFα and cell survival was analyzed by CV. The bar graphs depict mean values ± SEM %. (E) Cells were stimulated with TNFα and caspase activation was assessed by WB analysis. (F) Cells were treated with TNFα and intracellular ROS accumulation was analyzed by flow cytometry. (*) denotes the p43 fragment of caspase-8 and cFLIPL. (#) denotes cleaved caspase-3 (p15). n.s., non-specific band.
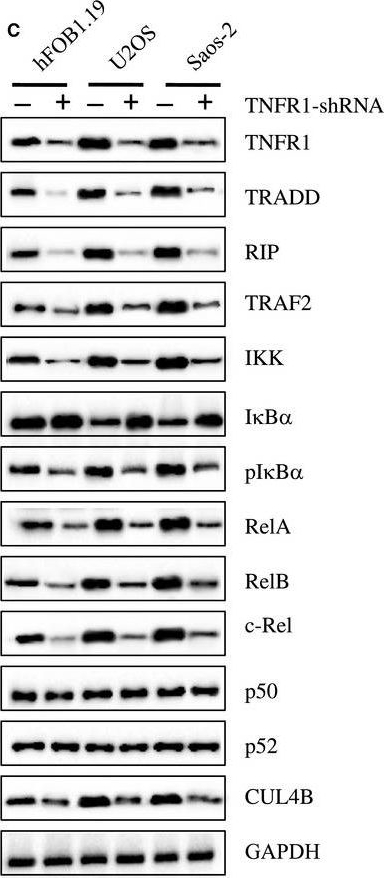 TNFα/NFκB axis is activated in human osteosarcoma cells. (A) The protein levels of critical members in the TNFα/NFkB axis. The protein levels of TNFR1, TRADD, RIP, TRAF2, IKK, IκBα, phosphorylated IκBα (pIκBα), RelA, RelB, c-Rel, p50, p52, and CUL4B were measured in hFOB1.19, U2OS, MG63, Saos-2, and HOS cells. GAPDH was used as the loading control. (B) Effects of SPD304 on the protein levels of the TNFα/NFκB axis members. hFOB1.19, U2OS, MG63, Saos-2, and HOS cells were treated with SPD304 for 24h, and then, the levels of proteins indicated in (A) were determined by immunoblots. (C) Effects of knocking down KNFR1 on the protein levels of the TNFα/NFκB axis members. hFOB1.19, U2OS, and Saos-2 cells were transfected with TNFR1-shRNA, and the stable cell lines were subjected to immunoblots to determine the TNFα/NFκB axis member protein levels.
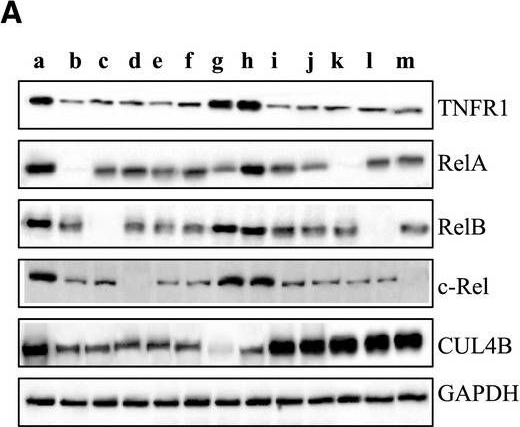 Blockage of TNFa/NFkB axis inhibits osteosarcoma cell growth. (A) Blockage of the TNFa/NFkB axis decreased TNFR1, RelA, RelB, c-Rel, and CUL4B levels. U2OS cells transfected with con-shRNA (a), U2OS-TNFR1-KD+RelA-KD (b), U2OS-TNFR1-KD+RelB-KD (c), U2OS-TNFR1-KD+c-RelA-KD (d), U2OS-SPD304 (e), U2OS-TNFR1-KD (f), U2OS-RelA-KD+CUL4B-KD (g), U2OS-CUL4B-KD (h), U2OS-TNFR1-KD+CUL4B (i), U2OS-SPD304+CUL4B (j), U2OS-TNFR1-KD+RelA-KD+CUL4B (k), U2OS-TNFR1-KD+RelB-KD+CUL4B (l), and U2OS-TNFR1-KD+c-Rel-KD+CUL4B (m) were subjected to western blots to examine the protein levels of TNFR1, RelA, RelB, c-Rel, and CUL4B. GAPDH was used as a loading control. (B) Blockage of the TNFa/NFkB axis inhibited osteosarcoma cell proliferation. Cells used in (A) were analyzed using the MTT assay to evaluate cell proliferation with absorbance measurement at 490nm. (C) Blockage of the TNFa/NFkB axis decreased colony formation rates. Cells from A were seeded onto 12-well plates and cultured with 0.1mL of fresh medium containing 0.5% FBS for two weeks. **P<0.001. (D) Blockage of the TNFa/NFkB axis decreased cell invasion. Cells from A were subjected to Boyden chamber assays, and the invasive cells were counted. **P<0.001. (E) Blockage of the TNFa/NFkB axis decreased the in vivo tumor forming ability. Cells from A were injected intradermally into the flanks of mice. Tumor volumes were measured with fine calipers at 5 day intervals.
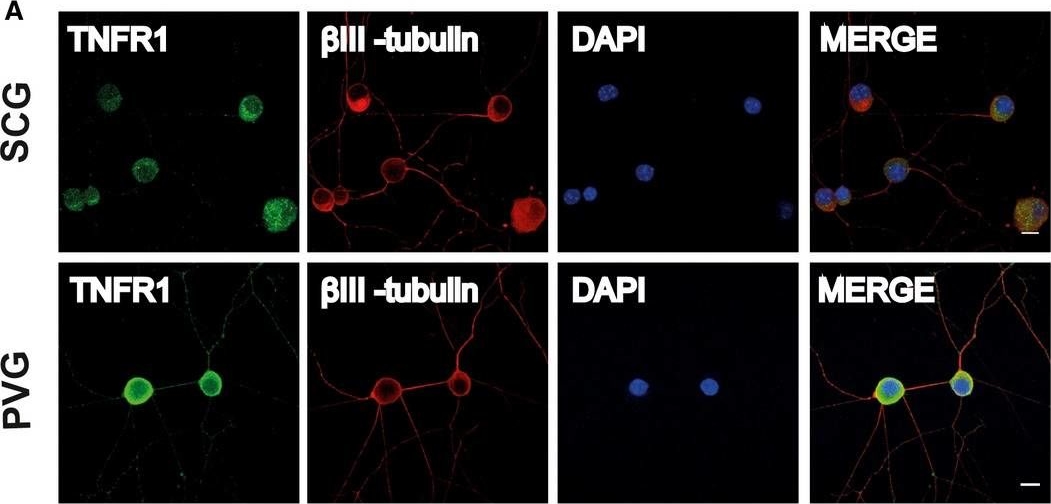 Immunolocalization of TNF, TNFR1, and TNFR2 on SCG and PVG neurons. Representative photomicrographs of P0 SCG neurons and PVG neurons double labeled with either anti-TNFR1 and anti-BetaIII-tubulin antibodies (A) or anti-TNF and anti-BetaIII-tubulin antibodies (B) or anti-TNFR2 and anti-BetaIII-tubulin antibodies (C) after 24h culture in NGF-supplemented medium. The preparations were also counterstained with the nuclear marker, DAPI. Scale bars, 10μm. [Colour figure can be viewed at wileyonlinelibrary.com]
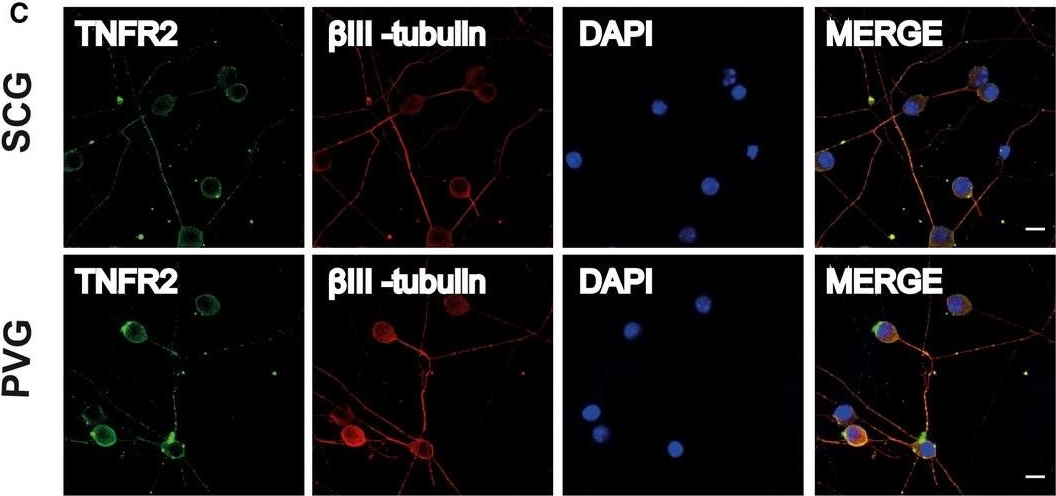 Immunolocalization of TNF, TNFR1, and TNFR2 on SCG and PVG neurons. Representative photomicrographs of P0 SCG neurons and PVG neurons double labeled with either anti-TNFR1 and anti-BetaIII-tubulin antibodies (A) or anti-TNF and anti-BetaIII-tubulin antibodies (B) or anti-TNFR2 and anti-BetaIII-tubulin antibodies (C) after 24h culture in NGF-supplemented medium. The preparations were also counterstained with the nuclear marker, DAPI. Scale bars, 10μm. [Colour figure can be viewed at wileyonlinelibrary.com]
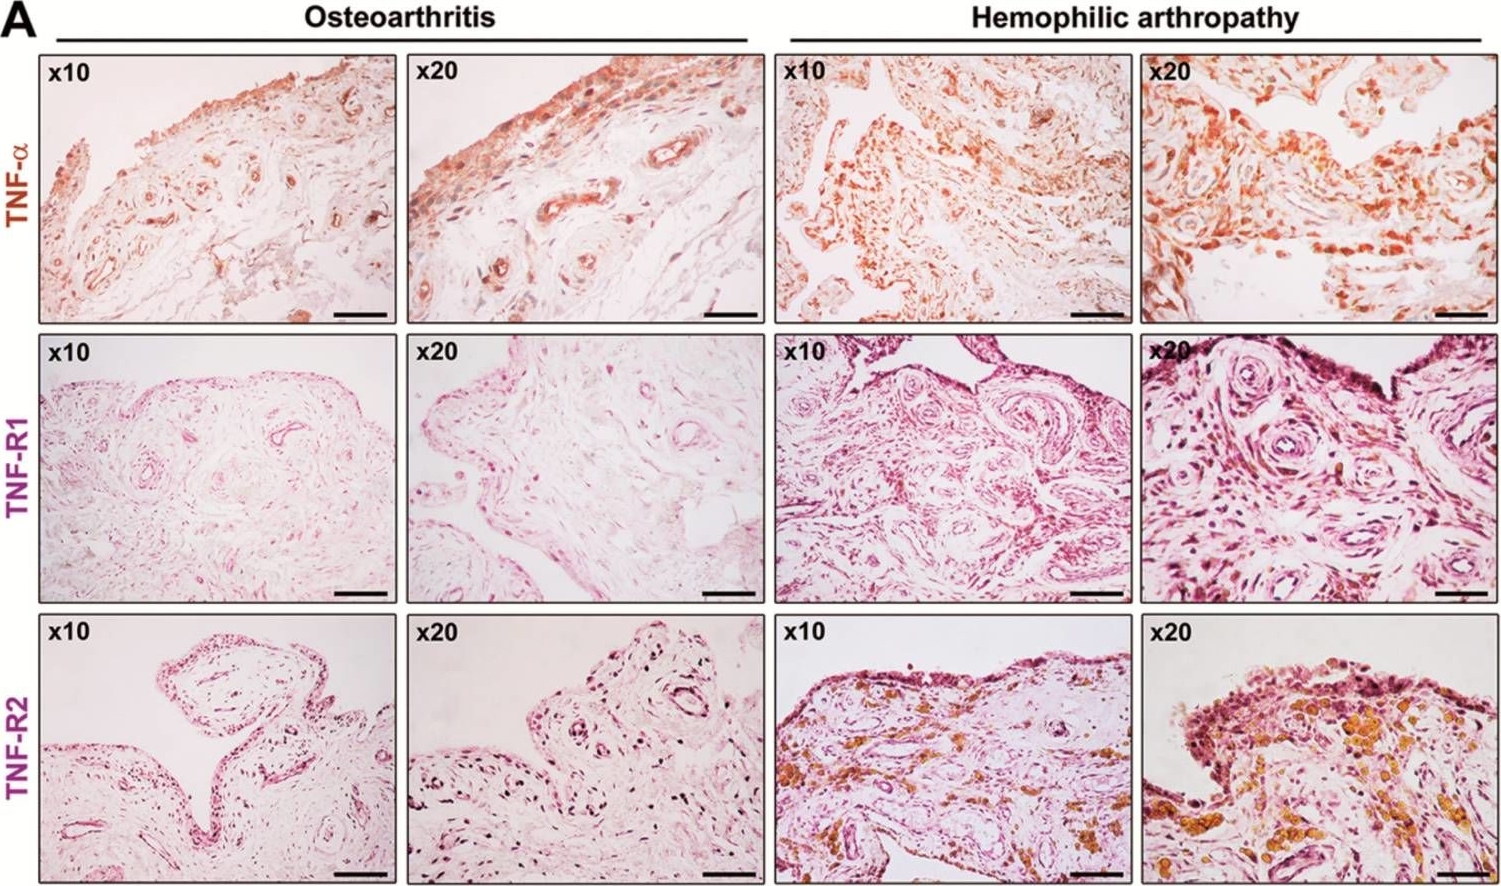 Expression of tumor necrosis factor (TNF)-a, TNF receptor 1 (TNF-R1), and TNF receptor 2 (TNF-R2) in synovial tissue from patients with hemophilic arthropathy (HA) and osteoarthritis (OA). (A) Representative microphotographs of tissue sections subjected to immunoperoxidase-based immunohistochemical staining for TNF-a (brown color), TNF-R1, and TNF-R2 (purple color) are shown. TNF-a, TNF-R1, and TNF-R2 immunostaining is strongly increased either in the hyperplastic lining or in the sublining layers of the HA synovium compared to non-inflamed OA control synovium. Original magnification: x10 and x20. Scale bar: 200 µm (x10 panels), 100 µm (x20 panels). (B) Western blotting of total protein extracts from the synovium of HA patients (n = 10) and OA controls (n = 8). Representative immunoblots for TNF-a, TNF-R1, and TNF-R2 are shown. The densitometric analysis of the bands normalized to a-tubulin is reported in the histograms. Data are the mean ± SEM of the optical density in arbitrary units (a.u.). * p < 0.05 vs. OA (Student's t-test).
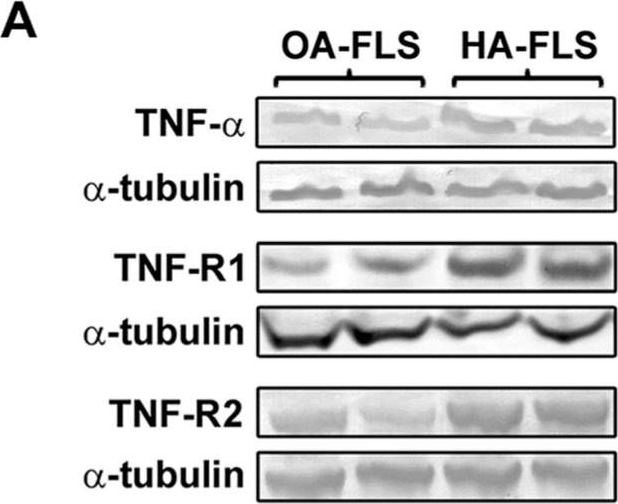 Fibroblast-like synoviocytes (FLS) from patients with hemophilic arthropathy (HA-FLS) overexpress tumor necrosis factor (TNF)-a, TNF receptor 1 (TNF-R1), and TNF receptor 2 (TNF-R2) and effectively proliferate in response to TNF-a. (A) Western blotting of total protein extracts from cultured HA-FLS and osteoarthritis control FLS (OA-FLS). Representative TNF-a, TNF-R1, and TNF-R2 immunoblots are shown; a-tubulin was used as a loading control. The densitometric analysis of the bands normalized to a-tubulin is reported in the histograms. Data are mean ± SEM of optical density in arbitrary units (a.u.). * p < 0.05 vs. OA-FLS (Student's t-test). (B) Cell viability evaluated at the basal condition or after treatment with recombinant human TNF-a (10 ng/mL) using the water-soluble tetrazolium (WST)-1 cell proliferation reagent. Cell viability in response to TNF-a is expressed as the percentage increase/decrease over the basal response for both HA-FLS and OA-FLS. Bars represent the mean ± SEM. Results are representative of three independent experiments performed with each one of the six HA-FLS and six OA-FLS lines. * p < 0.05 vs. the respective basal condition (Student's t-test). (C) Levels of active (cleaved) caspase-3 in HA-FLS and OA-FLS, as measured by the specific enzyme-linked immunosorbent assay on cell lysates. Data are the mean ± SEM of three independent experiments performed in triplicate with each one of the six HA-FLS and six OA-FLS lines.
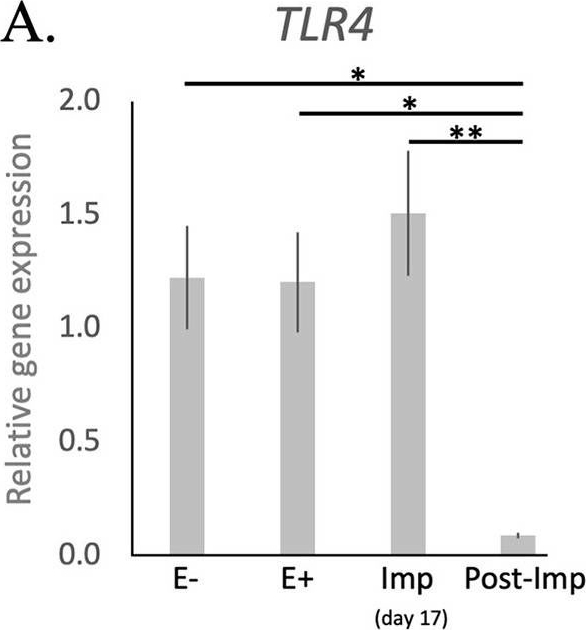 Relative gene expression and localization of TLR4, IDO1 and AIF1 in the canine uterus. (A-C) Relative gene expression as determined by semi-quantitative real time (TaqMan) PCR (mean ± SEM). One-way ANOVA was applied to test the variation among the investigated groups, revealing: P = 0.0033 for TLR4, P = 0.03 for IDO1, and P = 0.04 for AIF1. In the case of P < 0.05, this was followed by Tukey-Kramer multiple comparisons post-test. Bars with asterisks differ at: *P < 0.05, **P < 0.01. (D-M) Immunohistochemical localization of members of the TNF-system, IDO1, and AIF1 in the canine uterus at selected stages of early pregnancy. Signals of TNFa were present in macrophages during the pre-implantation (D) and implantation (E) periods. Similarly, both TNFR1 (F) and TNFR2 (G,H) were present in macrophages. In addition, weaker signals for both receptors were also observed in epithelial cells of uterine glands during pre-implantation (F,G) and in endothelial cells (F,H). Positive signals of IDO1 were detected in macrophages between superficial glands during pre-implantation (I) and were also detected in endothelial cells at the time of implantation (J). At post implantation, weaker signals were observed in macrophages localized in deep endometrium layers, as well as in endothelial cells (K). AIF1 positive signals were identified in macrophages close to superficial uterine glands in pre-implantation (L) and implantation (M) stages, while at post-implantation they were localized in the deep layer of the endometrium (N). Some weak signals were also observed in uterine glands at the pre-implantation period (L), while apparently stronger signals were observed in the same glands at implantation (M) and post-implantation (N). Weak positive signals were also detected in endothelial cells (M, N) (solid arrow = macrophages; closed arrowhead = uterine gland; open arrowhead = blood vessel). No staining is observed in the isotype controls [inset in (D,F,G,I,L)].
 - -
- -
Antibody DetailsProduct DetailsReactive Species Bovine ⋅ Canine ⋅ Drosophila ⋅ Hamster ⋅ Human ⋅ Monkey ⋅ Mouse ⋅ Porcine ⋅ Rabbit ⋅ Rat ⋅ Sheep ⋅ Xenopus ⋅ Yeast Host Species Rabbit Immunogen A synthetic peptide corresponding to a portion of mouse TNF-R1. This sequence is completely conserved in rat and human. Accession no. P25118. Product Concentration Lot Specific Formulation PBS containing 50% glycerol and 0.09% sodium azide. State of Matter Liquid Product Preparation Purified by peptide affinity chromatography Storage and Handling Store frozen product at or below -20°C. Thawed product may be stored for 2-4 weeks at 4°C. For optimal storage, aliquot and store at -20°C. Regulatory Status Research Use Only Country of Origin USA Shipping Next Day 2-8°C Applications and Recommended Usage? Quality Tested by Leinco Western Blot: 1ug/ml
Immunohistochemistry(paraffin): 1-10ug/ml Immunoprecipitation: 12.5ug/ml These are recommended concentrations. End user should determine optimal concentrations for their applications. Each investigator should determine their own optimal working dilution for specific applications. See directions on lot specific datasheets, as information may periodically change. DescriptionDescriptionSpecificity This antibody detects a 55kDa protein on heat shocked HeLa cell lysate SDS-PAGE immunoblots, corresponding to the molecular weight of TNF-R1. This antibody reacts with human, mouse, rat, hamster, bovine, rabbit, monkey, sheep, canine, pig, Drosophila, Xenopus, and yeast TNF-R1 Background Tumor necrosis factor alpha (TNF-α), also known as cachectin, is a 157-amino acid cytokine (~17.5 kDa) and a prominent member of the TNF superfamily. TNF-α is a key immunomodulatory molecule with potent proinflammatory effects across a broad spectrum of target cells. It is synthesized primarily by macrophages, natural killer (NK) cells, and activated T and B lymphocytes, and exists in both soluble and membrane-bound trimeric forms. TNF-α initiates signaling by binding to two distinct receptors: 1.) TNF receptor 1 (TNF-R1), which is broadly expressed on most normal and malignant cells 2.) TNF receptor 2 (TNF-R2), found primarily on endothelial cells and immune cells Upon receptor binding and trimerization, TNF-α triggers a cascade of signaling pathways that regulate critical biological processes including hematopoiesis, cell differentiation, apoptosis, lipid metabolism, endothelial activation, tumor development, and immune surveillance. Aberrant TNF-α signaling is associated with a wide range of pathologies, such as autoimmune diseases, cancer, osteoporosis, atherosclerosis, and type 2 diabetes. This TNF Receptor 1 Polyclonal Antibody is great for Immunohistochemistry and enables precise detection of TNF-R1 expression patterns in tissue samples, aiding in the study of inflammatory responses, tumor microenvironments, and TNF-α–mediated signaling pathways in both normal and diseased states. UniProt.org Research Area Growth Factors, Cytokines, Receptors References & CitationsQiu, Q., Lin, Y., et al. Evid Based Complement Alternat Med. 2014. 2014:571076 Lee, S. M., Yang, S., et al. PLoS One. 2014 Aug 6. 9(8):e104354. Rickard, J. A., Anderton, H., et al. Elife. 2014 Dec 2. 3:e03464 Siemieniuch, M. J., Szóstek, A. Z., et al. PLoS One. 2016 May 6.11(5):e0154934 Jaco, I., Annibaldi, A., et al. Mol Cell. 2017 Jun 1.66(5):698-710.e5 Xing, J., Lu, J., et al. Front Physiol . 2018 Oct 15. 9:1461 Maddahi A, Kruse LS, Chen QW, Edvinsson L. J Neuroinflammation. 2011 Aug 28;8:107. Arslan SÇ, Scheidereit C. PLoS One. 2011;6(10):e26069. Zhang C, Chen B, Jiang K, Lao L, Shen H, Chen Z. Mol Oncol. 2018 Apr;12(4):476-494. Erice C, Calhan OY, Kisiswa L, Wyatt S, Davies AM. Dev Neurobiol. 2019 Apr;79(4):317-334. Manetti M, Linari S, Romano E, Rosa I, et al. J Clin Med. 2019 Jun 28;8(7):939. Tavares Pereira M, Nowaczyk R, et al. Front Vet Sci. 2021 Feb 9;7:625921. Ekstrand J, Zemmler M, et al. Front Immunol. 2022 Mar 30;13:850240. Technical Protocols  Certificate of Analysis |
 Products are for research use only. Not for use in diagnostic or therapeutic procedures.